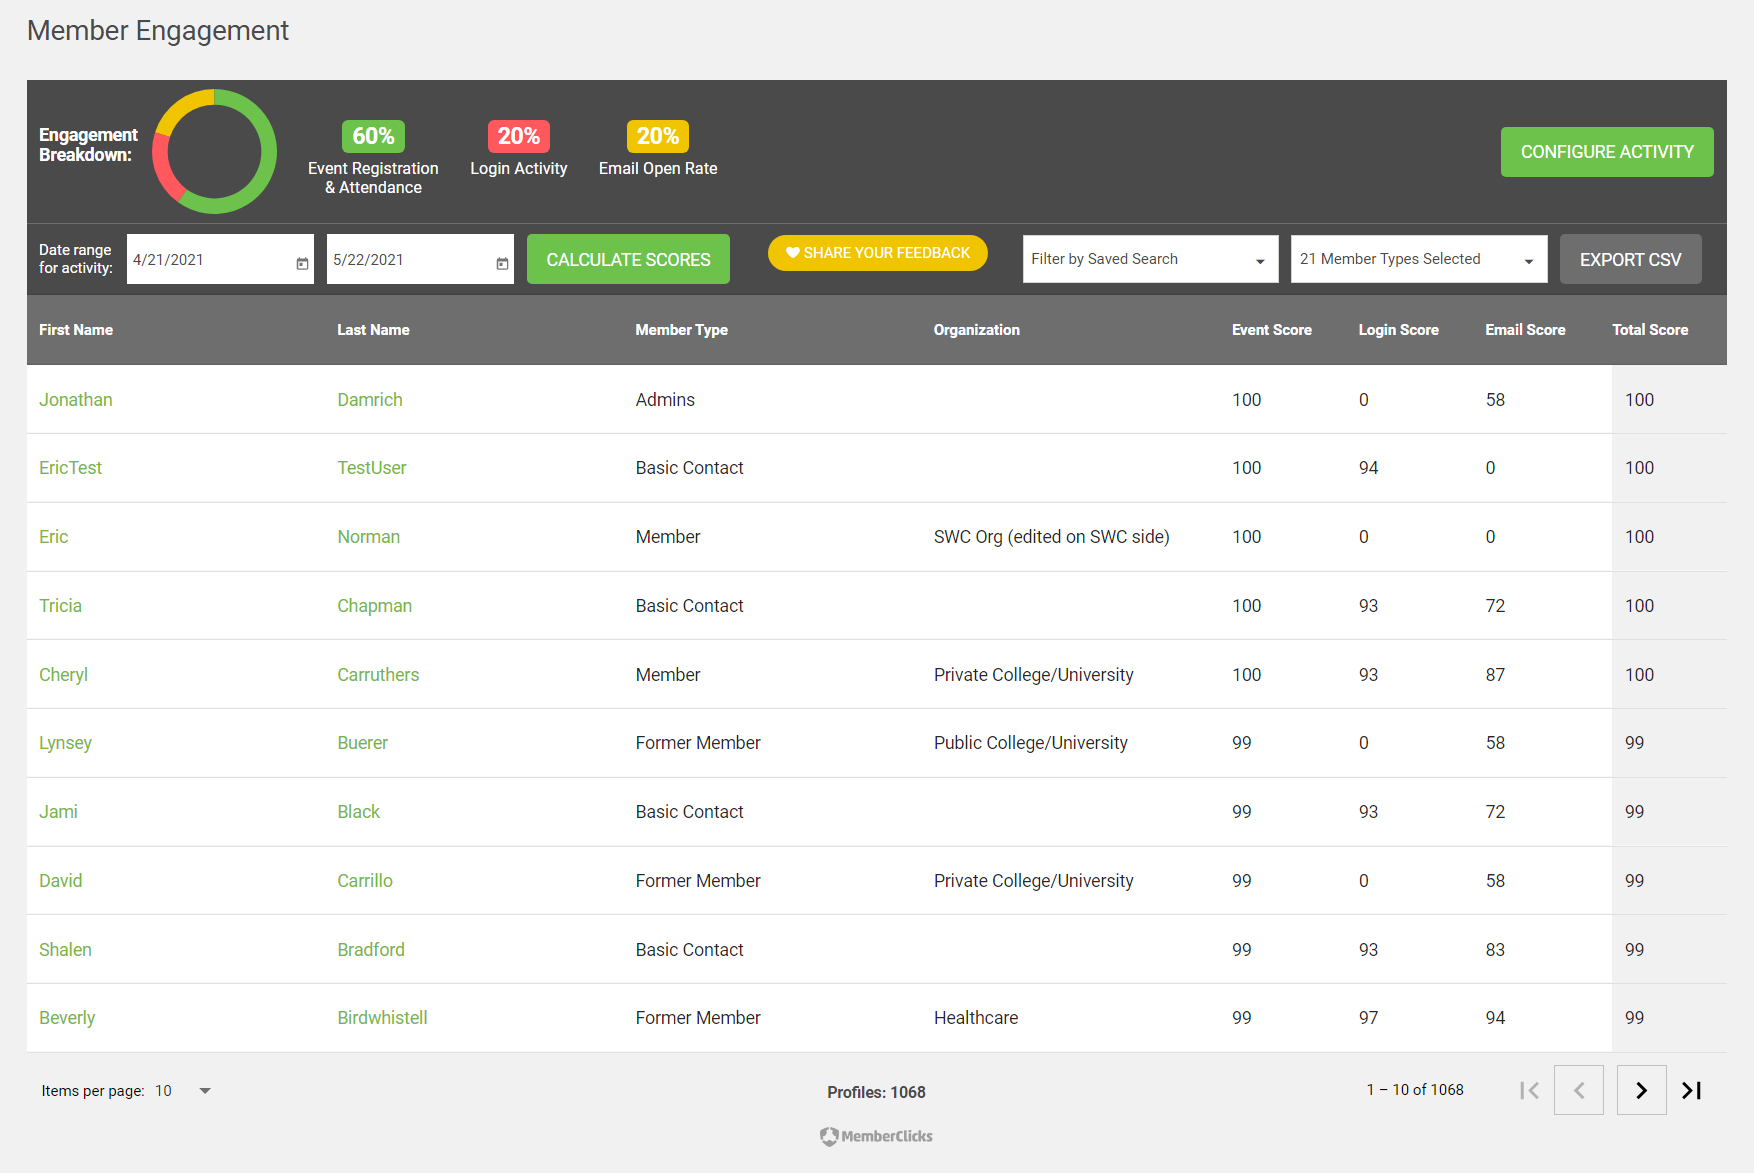
The Member Engagement Report calculates a weighted "Engagement Score" based on a breakdown of three key areas of engagement in your data: Event Registration/Attendance, Login Activity, and Email Open rates. You can configure how heavily each of these metrics weighs in the overall score of your members, and then run the report to calculate your members' score.

To view the Engagement Report, go to Reporting > Engagement in MC Professional. If you've never run the report before, no results will display - otherwise you'll see the results based on the previous calculation of the report. To update the default configuration for how much each activity is weighed, click Configure Activity.

Click and drag the pointers on each activity type to the desired percentage. If the total does not equal 100%, you'll see the red percentage and will not be able to save the configuration until all three equal 100%. Once the configuration is set to your desired breakdown, click Save Configuration.
Next, you'll need to set the date range for which you want to calculate the Engagement Scores. Enter a start and end date, and when you're ready to run the report, click Calculate Scores. See below for a detailed explanation of how each score is calculated.
Depending on the number of profiles and activities in your database, the report may take several minutes to run. You can leave the page and after report is fully calculated, you'll see the results any time you come back to the page (even after logging out and back in to MC Professional), until you explicitly re-calculate the scores.
Once the report is complete, you'll see all scores for all profiles in your database. To filter down the list of results by Member Types, or by any other Saved Search from the Profile List, use the dropdowns at the top of the result grid. The scores will not recalculate with these filters, but the list will be filtered down and you can choose Export to CSV to get an export in Excel with the filtered, calculated results.

Once you've run the Engagement report at least once, you'll also be able to see the latest-calculated score on each profile, in the Engagement Metrics tab. Click here for more details on the profile-specific engagement information.
How are scores calculated?
To create the most differentiation between scores for accurate analysis, as well as to look at member engagement in a relative way based on the typical engagement for your members overall, the following criteria are used when calculating scores:
- Event Registration Score: each profile gets a score ranging from 0 to 1. A 0 means no events attended. For all other profiles, the score will reflect their percentile ranking amongst all profiles that attended at least one event, based on how many events they attended compared to all others.
- Login Activity Score: each profile gets a score ranging from 0 to 1. A 0 means no logins were recorded. For all other profiles, the score will reflect their percentile ranking amongst all profiles that logged in at least once, based on how many logins they had compared to all others.
- Email Open Rate Score: each profile gets a score ranging from 0 to 1. A 0 means no emails were opened. For all other profiles, the score will reflect their percentile ranking amongst all profiles that opened at least one email, based on how many emails they opened compared to all others.
- Total Score: your configuration percentages come in at this point, and each one is multiplied times each of the scores above. For example, if you have a 60% events, 20% logins, 20% email opens configuration, the Total Score = (event score) * 0.6 + (login score) * 0.2 + (email score) * 0.2, and that total is multiplied by 100 for the overall score for the profile.
- Each month within the date range selected does this calculation, and the scores are then averaged out over the full date range for the final calculated scores in each column.